The Philippines has been experiencing rapid economic growth in the past 10 years. Did every region in the country experienced the same? or only a few privileged ones?
National Economy and Patrimony, Article 12, Section 1 of the Philippine constitution says,
“The goals of the national economy are a more equitable distribution of opportunities, income, and wealth; a sustained increase in the amount of goods and services produced by the nation for the benefit of the people; and an expanding productivity as the key to raising the quality of life for all, especially the underprivileged.”
Metro Manila is highly congested in road traffic, densely populated, and overwhelmigly strangled with twisting blocks of concrete highways. No doubt that Metro Manila is a huge metropolitan city and may already have exceeded its saturation point.
If you ask most Filipinos, especially those from the outskirt regions, they would prefer to leave their families and still move to Metro Manila where they think there are better opportunities. This has been the trend in the past even until recently given that there is not that much better opportunities available in their local regions.
Why is there a huge gap in developments between the Capital and the outskirt regions? Why are these developments too concentrated in the Capital and not well distributed?
The data I gathered and visualized could help us better understand this huge gap of development and poverty distributions between these regions.
I will be interchangeably using the Capital, Metro Manila, National Capital Region throughout the discussion.
Heavily Centralized Government
The Philippines is still heavily centralized unitary sctructured. All of the income and taxes are managed through the Capital. To simplify how it works, all of the regions income are collected by the capital and distributed back to the regions based on what the central government “thinks” the region needs.
The Great Divide
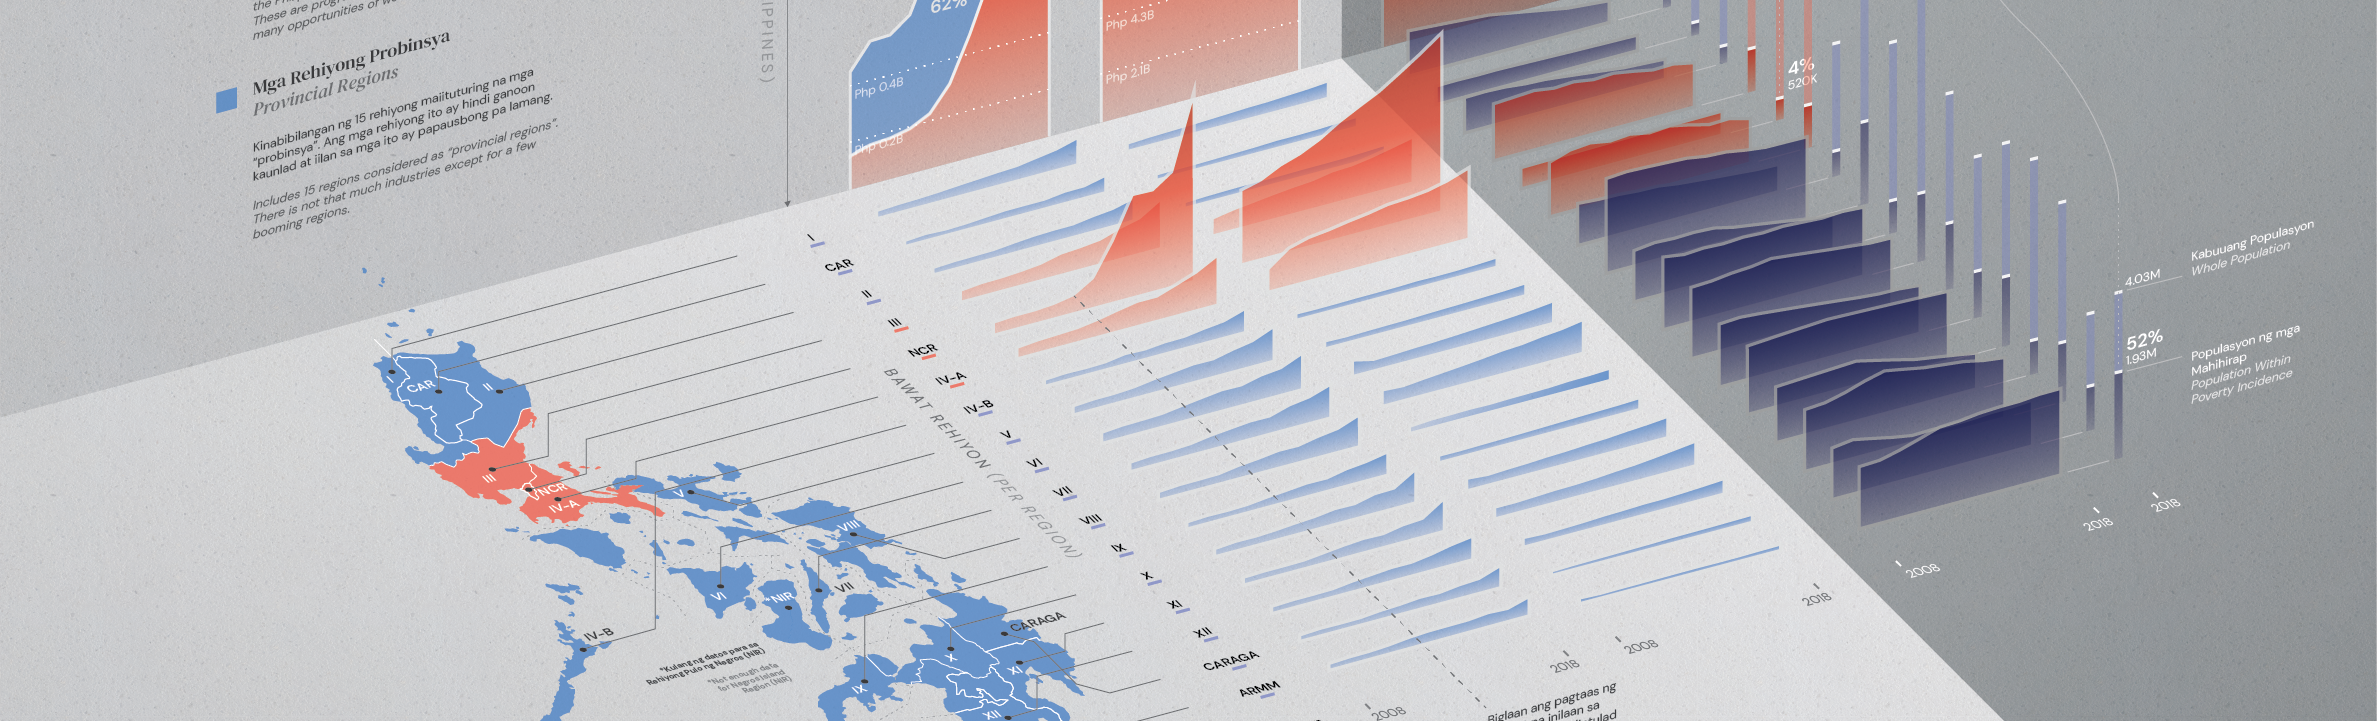
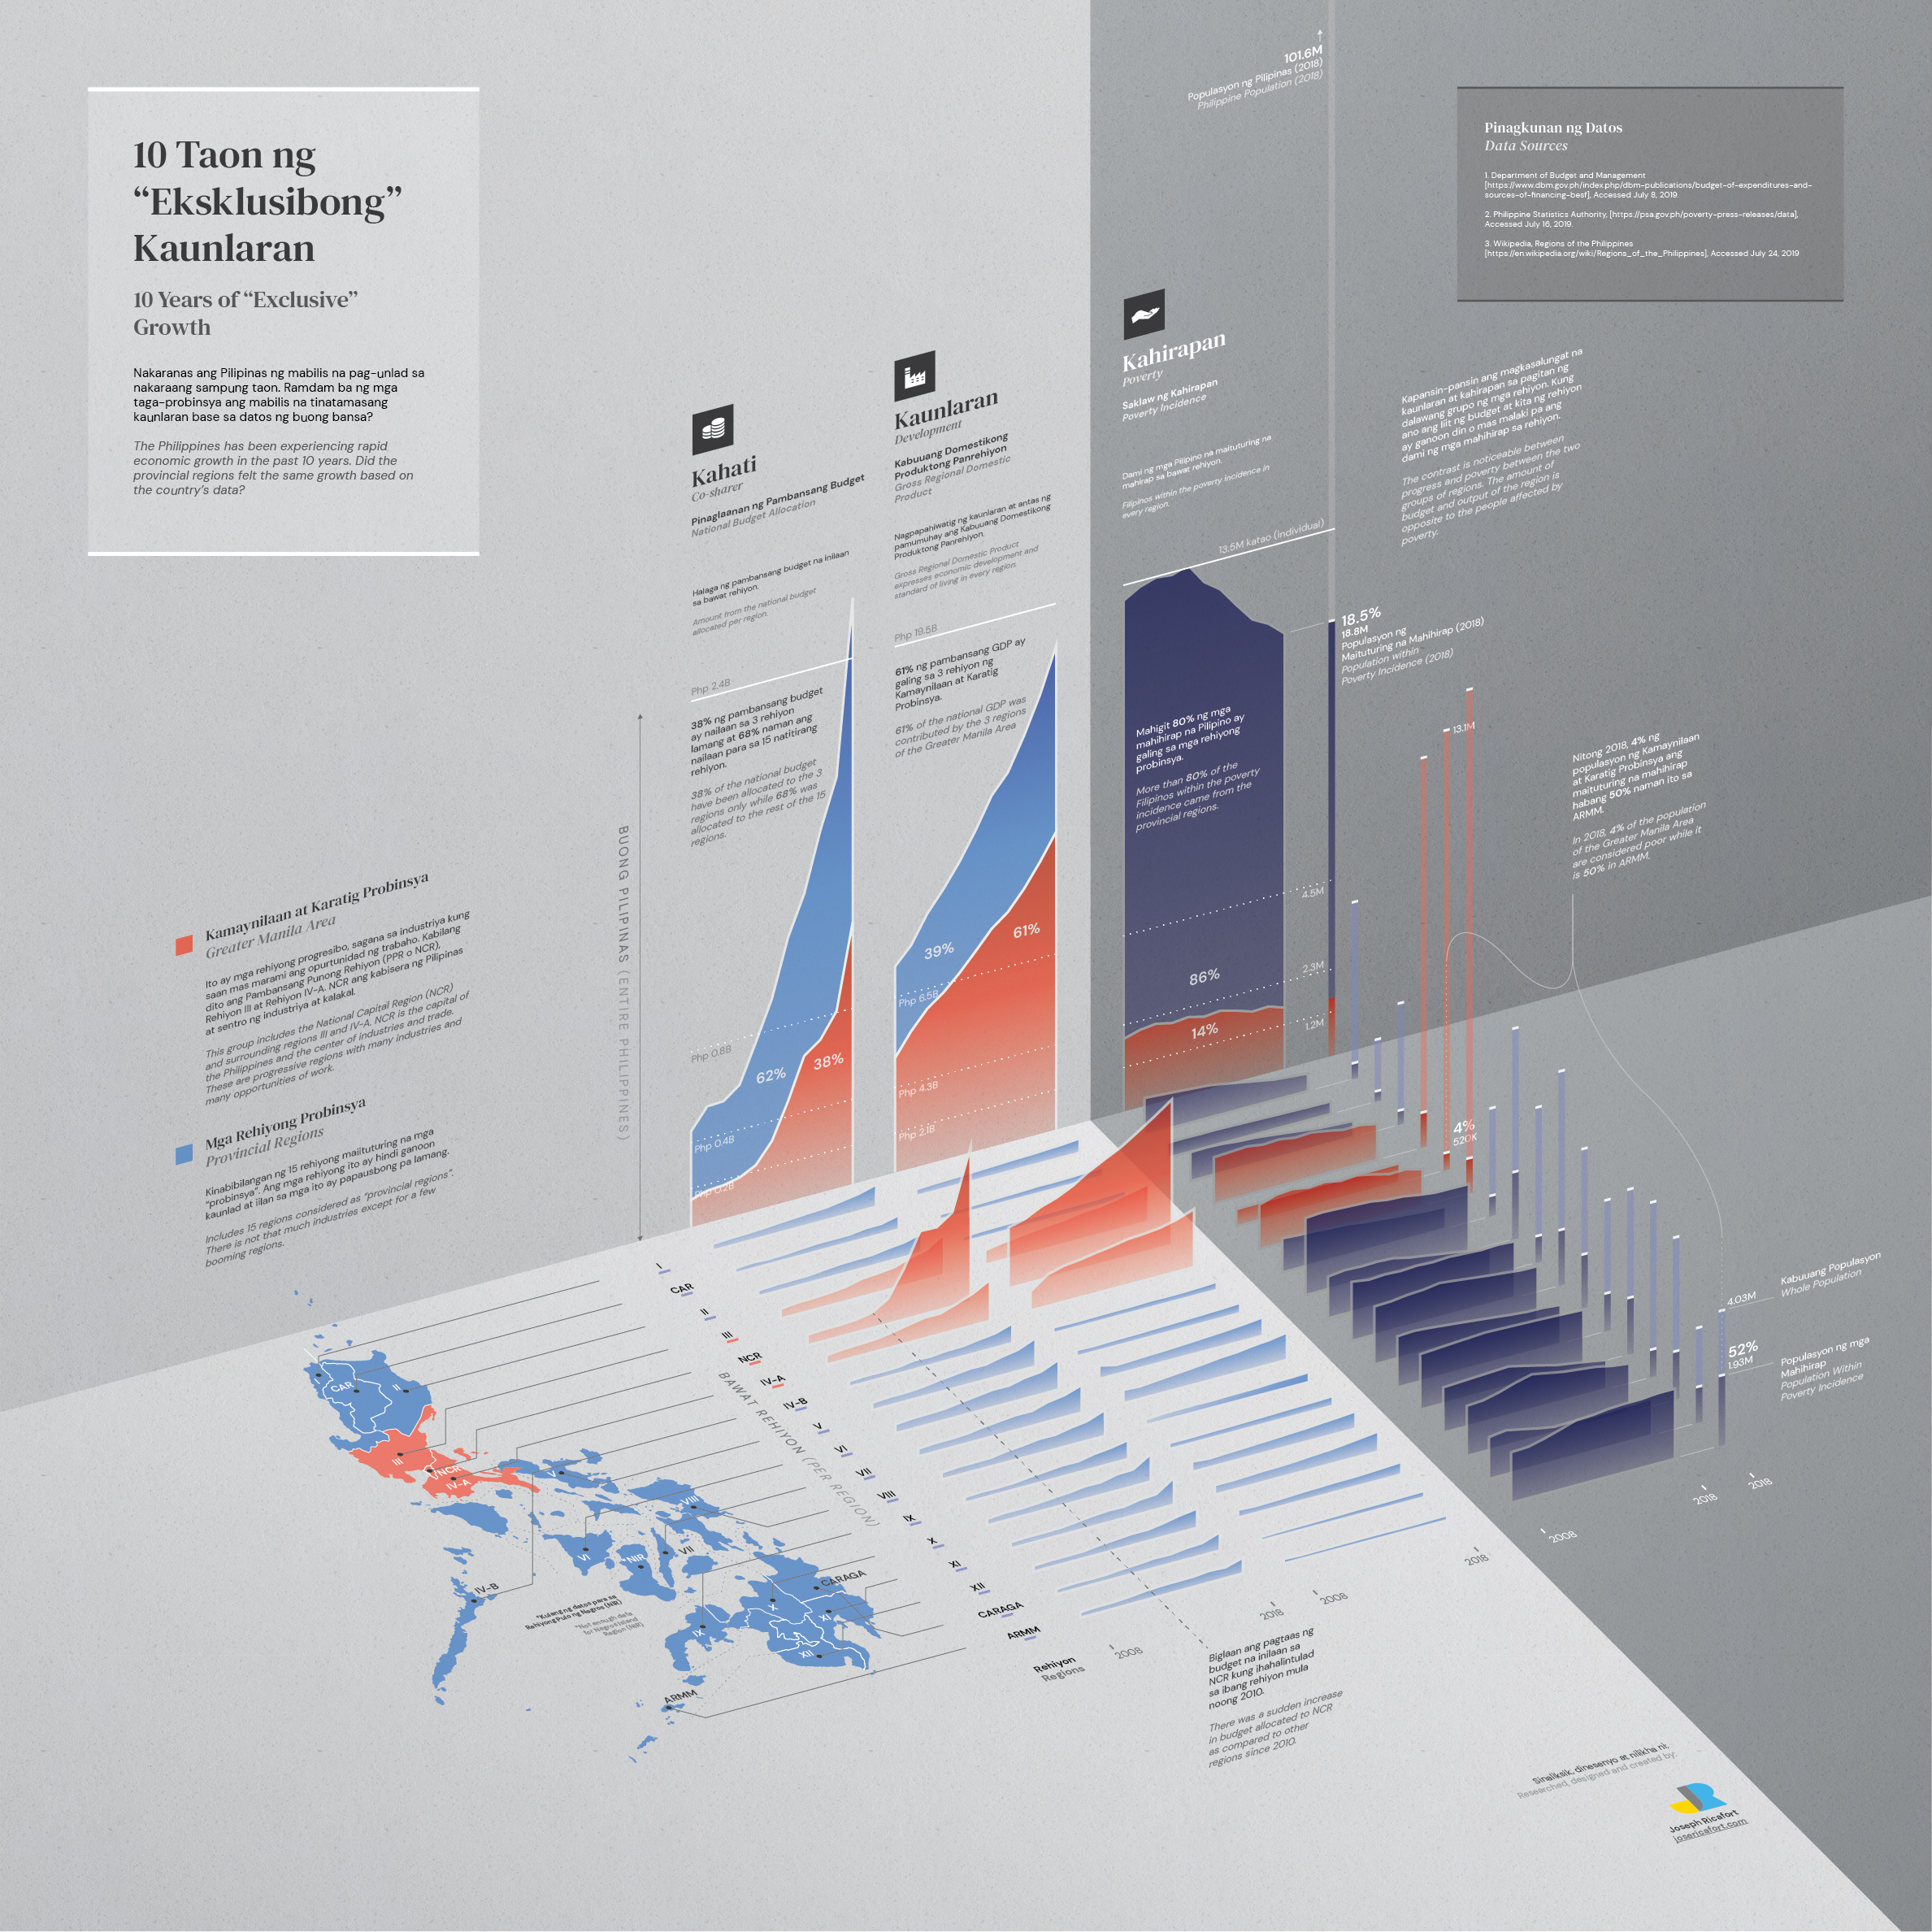
The developments are not specific to the National Capital Region alone but is extended as well to its surrounding regions. This extension is usually called the Greater Manila Area (GMA). The regions in the Greater Manila Area includes the National Capital Region and surrounding regions III and IV-A. The rest of the regions were categorized as “The Provinces”.
For the sake of emphasizing the huge gap in developments between the regions, we highlight these two groups upon visualizing.
Visualizing The Input, Output and Outcome for Every Region
I have found 3 important data that provides significant evidence on this rift between regions. These data include the National Budget Allocation (Input), Gross Domestic Product (Output), Poverty (Outcome).
The graphic below was intended to be printed as a huge poster. Apologize if you find it difficult to scan through the information. Click the graphic to view in detail.
View full graphic here
Measurements Used
I used the following metrics to visualize the input, the output and the outcome of what I discussed previously.
National Budget (Input) - each region contributes to the national budget and the central government dictates how much budget is allocated every region
Gross Regional Domestic Product (Output) - the income or output of each region. It often reflects progress and living conditions of an area or region
Poverty Incidence (Outcome) - People which are considered poor according to Philippine Statistics Authorities’ definition and calculation of Poverty Incidence
Some Noteworthy Considerations
- Filipino (Tagalog) as a Carrier Language - Using Filipino is rarely practiced in digital publications as most Filipino readers can read in English but this is not always the case. I tried to instill the value of inclusion and accessibility as much as possible. Most of the Filipino readers are accustomed to English but some Filipinos are capable of reading English so I tried to be as inclusive as much as I can. Only if possible, I would have included other Philippine languages as well.
Wrapping Up
To wrap things up, here are a few of my realizations:
- The Greater Manila Area, especially the National Capital Region experienced and benefited the most in the rapid economic growth leaving the other regions at a slower pace.
- Poverty incidence is the lowest in the National Capital Region and higher among the provincial regions and does correlate to how the budget and output were distributed among the regions.
- The provision written in the constitution was far more different from reality. If we were to rewrite the constitution reflected from reality, this could sound more reasonable,
An inequitable distribution of opportunities, income, and wealth, quality of life for the few, especially the privileged.
Data Sources
Department of Budget and Management, [https://www.dbm.gov.ph/index.php/dbm-publications/budget-of-expenditures-and-sources-of-financing-besf], Accessed July 8, 2019.
Philippine Statistics Authority, [https://psa.gov.ph/poverty-press-releases/data], Accessed July 16, 2019.
Wikipedia, Regions of the Philippines [https://en.wikipedia.org/wiki/Regions_of_the_Philippines], Accessed July 24, 2019
The Constitution of the Republic of the Philippines, [https://www.officialgazette.gov.ph/constitutions/1987-constitution/], Accessed August 20, 2019.